
Previous

Next
Home > Building Your Application > Using an Interactive Report
 Previous |
 Next |
This exercise guides you through some commonly used report options available to users when they run interactive reports. These options allow the user to perform certain tasks quickly.
Topics:
You already used the Select Column option from the Actions menu to add columns to the report display. In this section, you run the application and use some of the various search, sort, highlight and reset features to manipulate the Departments interactive report.
This tutorial only touches on some of the most prominent functionality available with interactive reports. For complete details see "Customizing Interactive Reports" in Oracle Application Express Application Builder User's Guide.
Both developers and end users can save an interactive report. However, only a developer can save the report that initially displays, called the Primary Default report.
You can save four types of interactive reports:
Primary Default (Developer Only). The Primary Default is the report that initially displays. Primary Default reports cannot be renamed or deleted.
Alternative Report (Developer Only). Enables developers to create multiple report layouts. Only developers can save, rename, or delete an Alternative Report.
Public Report (End user). Can be saved, renamed, or deleted by the end user who created it. Other users can view and save the layout as another report.
Private Report (End user). Only the end user that created the report can view, save, rename or delete the report.
To save current report settings as the default:
Click the Actions menu.
Select Save Report.
The Save Report settings appear.
From Save, select As Default Report Settings.

The Default Report Type settings appear
Select Primary and click Apply.
The report will show all columns when the user selects the Reset option from the Actions menu or when the page is reset by a Reset Interactive Report command, RIR.
|
See Also: For a description of how to save as a report as a Named Report see "Customizing Interactive Reports" in the Oracle Application Express Application Builder User's Guide. |
This exercise shows you how a user can add a filter to the Departments report. This example creates a filter to show all departments with the exception of departments with an Id of 60.
There is more than one way a user can create a filter. The user can add a filter from the:
Search Bar
Actions Menu
Column Heading
The Actions menu offers more options than the others. For a quick filter using the equals operator, the Search Bar or column heading are the quickest methods. For anything else, use the Filter option from the Actions menu.
To create a filter for all departments not equal to 60:
Click the Actions menu.
Select Filter.
The filter settings display. Note the user can also click the column heading link to create a filter for that column. Creating a filter from the column heading menu, however, is limited to the equal operator.

From Operator, select the not equals operator (!=).
From Expression, select 60.
Click Apply.
The Departments report is displayed with the Department_Id!=60 filter applied. All departments, accept for the IT department with a Department Id of 60, are included in the report.
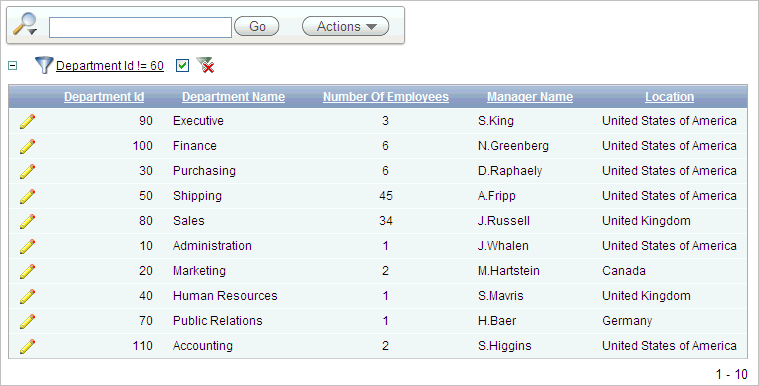
Notice the filter displays at the top of the report. You can edit, disable, or delete this filter. To edit, click on the filter name. To disable, uncheck the check box. To delete, click on the Delete icon that looks like an X over the filter icon.
Deselect the check box next to the Department Id!=60 filter to disable it.
The report shows data for all Department Ids.
In this exercise, you learn how the user can reorder the data for each column.
To change the sort order:
Click the Actions menu.
Select Format and then Sort.
The sort settings are displayed. Note this option is also available for each column by clicking the column heading. The Actions menu is quicker when changing the sort order for multiple columns.
Select Department Name for the first column entry.
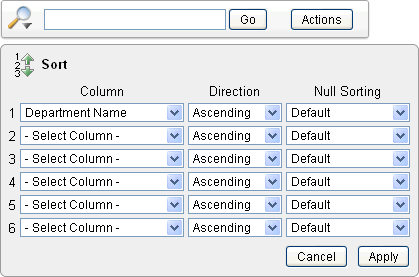
Click Apply.
The report shows the Department Name column in ascending alphabetical order.
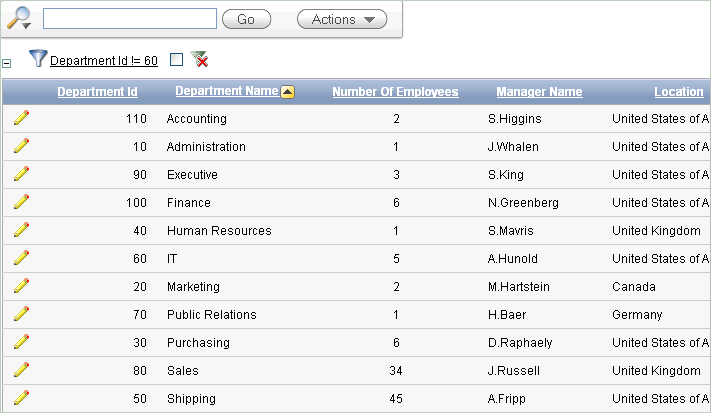
Notice the up arrow icon after the Department Name that indicates the column has been sorted in ascending order. You can click on this arrow to resort the column.
Another way to reformat a report is to create a controlled break. A controlled break enables the user to delineate data into clearly visible groups.
To add a controlled break:
Click the Location column heading.
The column heading menu appears.
Click the Control Break icon as shown below.
Note this same option is also available from the Actions, Format menu.
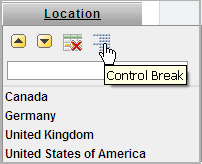
The report is reformatted to show a break after each group of rows that share the same location.
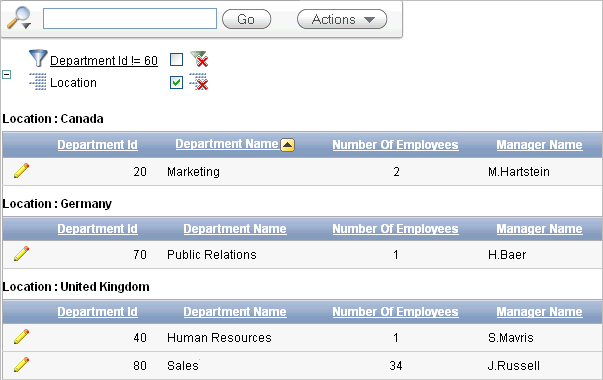
Note the Location control break report setting displays under the Search bar.
You can also display details for a row by selecting the Single Row icon.
To display the single row view:
Locate the Single Row View icon for the first row.
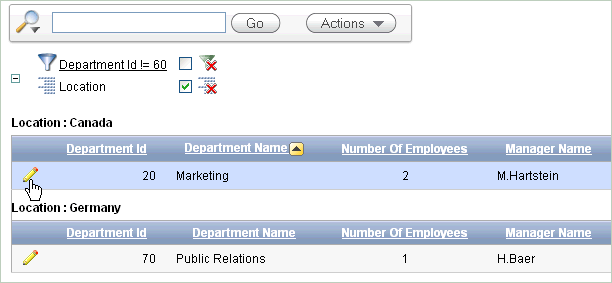
Select the Single Row View icon for the first row.
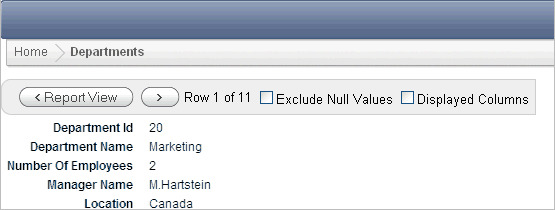
The details page for the first row appears.
You can revert the report settings back to the saved default settings. When an interactive report is reset, the default settings are applied to the report. An interactive report can be reset by the user and by the developer under the following conditions:
A user can reset an interactive report if the Reset option is available from the Actions menu. This option is enabled or disabled by the developer. For further details see "Customizing Interactive Reports" in the Oracle Application Express Application Builder User's Guide.
A developer can specify that an interactive report be reset when it is called from another page. The Reset Interactive Report command, RIR, is used for this purpose. For further details see "Customizing Interactive Reports as a Developer" in the Oracle Application Express Application Builder User's Guide.
To return to the default settings:
Click the Report View.
Click the Actions menu and select Reset.
When prompted to restore the default settings, click Apply.
The report goes back to the default report settings saved in the previous section.