Previous

Next
Home > Understanding the Sample Ap... > Understanding Sample Applic... > About the Reports Page
 Previous |
 Next |

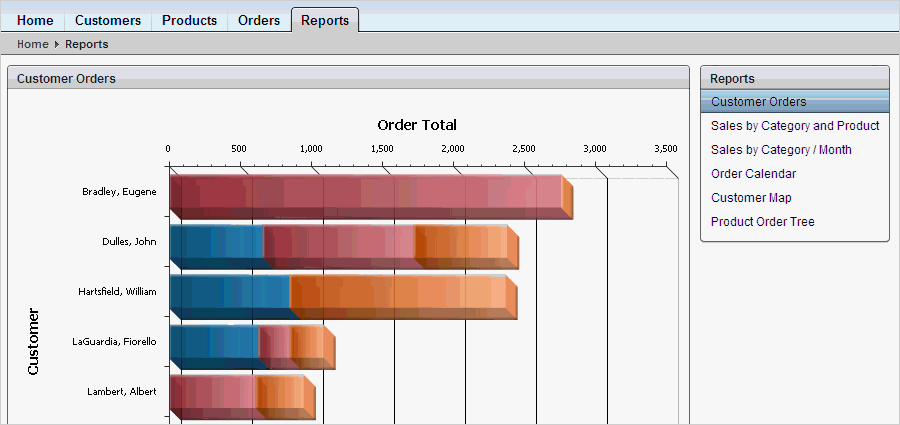
The Charts page enables you to view information in various formats, including bar chart, cluster bar, pie chart, calendar, map, and tree. To change the view, make a selection under Reports on the right side of the page.