Previous

Next
Home > Adding Application Components > Creating Reports > Creating a Report Using a W...
 Previous |
 Next |
Application Builder includes a number of built-in wizards for generating reports.
To create a report using a wizard:
On the Workspace home page, click the Application Builder icon.
Select the application.
Click Create Page and click Next.
Select Report and click Next.
Select a report type and click Next. Option include:
Interactive Report - Creates an interactive report based on a custom SQL SELECT statement you provide. For assistance in writing the SQL query, click the Query Builder button. End users can customize the report layout and data displayed by selecting options on the Actions menu.
Classic Report - Creates a report based on a custom SQL SELECT statement or a PL/SQL function returning a SQL SELECT statement that you provide. For assistance in writing the SQL query, click the Query Builder button.
Report on Web Service Result - Creates a report based on a Web service result. To learn more, see "Implementing Web Services".
Wizard Report - Creates a classic report without requiring any SQL knowledge. Select the appropriate schema, table, columns, and result set display.
Follow the on-screen instructions. To learn more about a specific field, click the item label.
When Help is available, the item label changes to red when you pass your cursor over it and the cursor changes to an arrow and question mark. See "About Field-Level Help".
Oracle Application Express includes two main report types, an interactive report and a classic report. The main difference between these two report types is that interactive reports enable the user to customize the appearance of the data through a searching, filtering, sorting, column selection, highlighting, and other data manipulations.
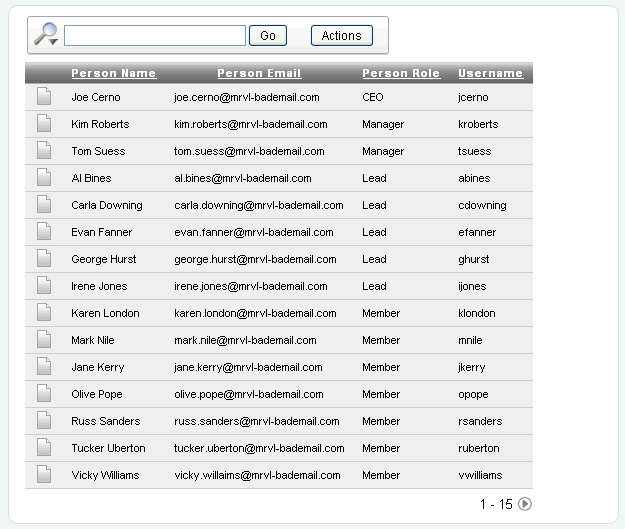
The following is an example of an interactive report.

Notice that the interactive report includes a Search Bar, Column Heading Menu links, and Link Column icons in the first column of each row. For a complete description of these components, see "Customizing Interactive Reports".
When using an interactive reports you can:
Include one interactive report per page
Display 100 columns using report columns. You can edit additional columns using Tree view or paginating through Report Column Attributes.
Include 999 rows per column heading filter (if no custom LOV is specified in the column attributes)
About Classic Reports
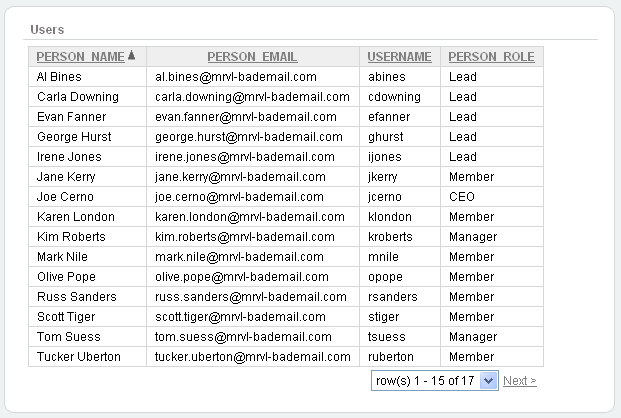
In contrast, a classic report does not include any of these customization features. The following is an example of a classic report built on top of the same data.

Classic reports do not include a Search Bar and the links at the top of each column only support basic sorting.
When using a classic report, you view 100 columns using report columns. You can edit additional columns using Tree view or paginating through Report Column attributes.